Apache Superset Tutorial
Data engineers often use Apache Superset to build and manage data pipelines, ensuring that the right data is available and structured correctly for visualization. They also configure the data connections, optimize performance, and ensure that the dashboards are scalable.
However, data analysts are key users of Apache Superset, utilizing the platform to create detailed dashboards that help in making decisions. With its drag-and-drop interface and extensive customization options, analysts can quickly generate visual reports highlighting trends, anomalies, and key insights.
At Data Engineer Academy, we focus on providing practical skills. In this tutorial, we’ll explore the features of Apache Superset and demonstrate how you can use this tool to enhance your data storytelling skills. Whether you’re a beginner or a seasoned professional, this guide will help you master the art of data visualization and dashboard creation.
What is Apache Superset?
Apache Superset is an advanced, open-source data exploration and visualization tool that empowers data professionals to create complex dashboards and interactive reports with ease. Designed to handle data at scale, Superset integrates seamlessly with various data sources, ranging from relational databases to modern cloud-native data warehouses, making it a versatile choice for organizations of all sizes.

At its core, Apache Superset offers a rich suite of features that cater to the needs of data engineers, data analysts, and business intelligence professionals. One of the key strengths of Superset lies in its ability to connect to virtually any database, including those powered by SQLAlchemy, Druid, and Presto. This flexibility means that whether your data resides in PostgreSQL, MySQL, Amazon Redshift, or a Hadoop-based data lake, Superset can tap into it, allowing you to visualize your data without needing to move it or transform it unnecessarily.
The platform’s intuitive drag-and-drop interface is built to accommodate both technical and non-technical users. Data engineers can leverage Superset’s SQL Lab, a powerful integrated SQL editor, to write and execute complex queries directly against the connected databases. This functionality is particularly useful for those who need to dig deep into data, perform exploratory analysis or build custom metrics. Meanwhile, the visualization layer abstracts much of the complexity, enabling analysts and business users to focus on creating insightful dashboards without needing to write code.
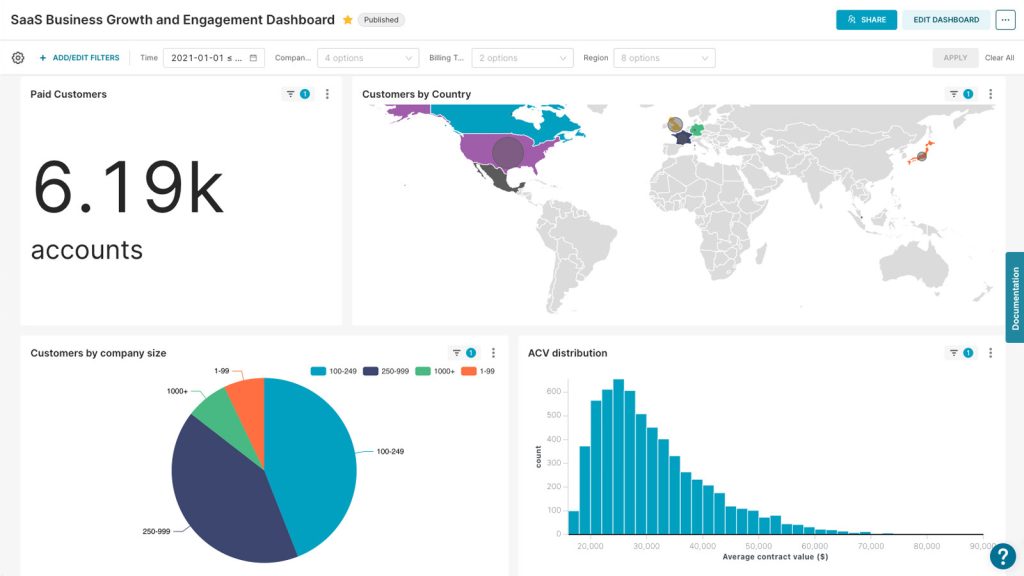
Beyond its basic charting capabilities, Apache Superset excels in offering advanced visualization options. It supports a wide array of chart types, including bar charts, line charts, scatter plots, and heat maps, as well as more specialized visualizations like time-series graphs and geospatial charts. Each of these visualizations can be extensively customized, allowing users to adjust colors, labels, axes, and more to fit their specific needs. Furthermore, Superset’s ability to create interactive dashboards — with features like drill-down, filtering, and cross-filtering between charts — enhances the storytelling aspect of data, making it easier for stakeholders to derive actionable insights.
Setting Up Apache Superset
Setting up Apache Superset involves several steps, from installing the necessary dependencies to configuring the tool to connect to your data sources. This guide will walk you through each step, ensuring a smooth installation and setup process.
Step 1: Prepare your environment
Before you install Apache Superset, ensure your environment meets the necessary prerequisites:
- Operating system: Superset can be installed on macOS, Linux, or Windows (via WSL).
- Python: Superset requires Python 3.7 or later. Verify your Python version by running python3 –version in your terminal.
- Node.js and npm: These are needed for building the frontend assets. Install the latest versions from the Node.js website.
- Virtual environment (optional but recommended): To avoid dependency conflicts, it’s a good practice to use a Python virtual environment. You can create one with the following command:
python3 -m venv superset-venv
source superset-venv/bin/activate
Step 2: Install Apache Superset
With your environment ready, you can proceed to install Apache Superset using Python’s package manager, pip.
- Upgrade pip and setup tools:
pip install --upgrade pip setuptools
2. Install Apache Superset:
pip install apache-superset
This will install Superset and its dependencies.
Step 3: Initialize the database
Superset requires a metadata database to store information about dashboards, charts, users, and more. By default, it uses SQLite, but you can configure it to use other databases like PostgreSQL or MySQL.
- Set up the database:
superset db upgrade
This command initializes the database and applies any necessary migrations.
2. Create an admin user:
You’ll need an admin user to access the Superset web interface. Create one with the following command:
export FLASK_APP=superset
superset fab create-admin
You’ll be prompted to enter your username, email, and password.
3. Load examples (optional):
If you’re new to Superset, it might be helpful to load some example dashboards and data:
superset load_examples
4. Initialize superset:
Finally, initialize Superset’s roles and permissions
Step 4: Start the Apache Superset server
With everything set up, you can start the Superset server.Run the Server:
superset run -p 8088 --with-threads --reload --debugger
Step 5: Connect to a Database
Now that Superset is up and running, you can connect it to your data sources.
- Navigate to the sources tab:
In the Superset web interface, go to Data > Databases.
Add a New Database:
Click on the + Database button. You’ll need to provide the connection details, including the SQLAlchemy URI. For example, to connect to a PostgreSQL database, your URI might look like this:
postgresql+psycopg2://username:password@hostname/dbname
2. Test the connection:
After entering your database details, click Test Connection to ensure that Superset can connect to your database.
3. Save the connection:
If the connection test is successful, save the configuration. Your database is now connected, and you can start exploring and visualizing your data.
Step 6: Create Your first dashboard
With your data source connected, you can now create your first dashboard.
- Explore a dataset:
Go to Data > Datasets and select the dataset you want to explore. Click on Explore to start creating visualizations. - Build visualizations:
In the Explore view, you can select various chart types, apply filters, and customize your visualizations. Once you’re satisfied with the result, save it. - Add to a dashboard:
After saving your visualization, you can add it to a dashboard. You can either create a new dashboard or add it to an existing one. - Customize and save the dashboard:
Arrange the visualizations in your dashboard, add text boxes or filters as needed, and save your work. Your dashboard is now ready to share with others.

Step 7: Secure Superset instance
To ensure your Superset instance is secure:
- Configure your web server to serve Superset over HTTPS.
- Use the RBAC system to control access to various features and data within Superset.
- Keep your Superset installation updated to benefit from the latest features and security patches.
Follow these steps to set up a fully functional Apache Superset instance. You’ll be ready to create and share powerful data visualizations. Whether you’re setting it up for personal use, a small team, or a large organization, Apache Superset’s flexibility and scalability make it a great choice for your data exploration needs
Connecting to a Data Source
One of the features of Apache Superset is its ability to connect to a wide range of data sources, enabling you to visualize and explore your data directly from the platform. Whether you’re working with traditional relational databases, cloud-native warehouses, or big data systems, Superset’s flexibility allows you to connect, query, and visualize your data effortlessly. Here’s a step-by-step guide to connecting to a data source in Apache Superset.
Step 1: Access the database connection interface
Once your Superset instance is up and running:
- Open your web browser and navigate to http://localhost:8088 (or the appropriate URL if hosted remotely). Use your admin credentials to log in.
- From the top menu, click on Data and then select Databases. This will bring you to the database management screen, where you can view, edit, or add new database connections.
Step 2: Add a new database connection
To add a new database:
- On the Databases page, click the + Database button located in the upper-right corner. This opens the database configuration form.
- Provide a descriptive name for your database connection. This name will appear in Superset whenever you are selecting a data source.
Superset supports a wide range of databases, including MySQL, PostgreSQL, SQLite, Oracle, SQL Server, and more.
Step 3: Test the database connection
Before saving your connection:
- After entering the necessary details, click on the Test Connection button. Superset will attempt to connect to the database using the provided credentials and connection string.
- If the connection fails, review the error message provided by Superset. Common issues include incorrect credentials, network problems, or misconfigured connection strings. Double-check your SQLAlchemy URI and ensure that the database is accessible from the Superset server.
Step 4: Save the database connection
Once the connection test is successful, click on Save to store the database connection in Superset. Your database is now available as a data source within the platform.
Step 5: Exploring your data
With the database connection established, you can now explore your data:
- Go to Data > Datasets and click on + Dataset to add a new dataset from your connected database.
- Choose the newly connected database from the list, and then select the table or view you want to explore.
- Provide a name for your dataset, and specify any additional settings, such as metrics, columns, or filters. Save the dataset to make it available for visualizations.
- With the dataset saved, you can now use it to create charts, graphs, and dashboards. Navigate to the Explore page, select your dataset, and begin building visualizations.
Step 6: Managing connections and datasets
To modify or remove a database connection, return to the Databases page, select the connection you wish to edit, and update the configuration as needed. You can also delete connections that are no longer in use.
Regularly check the status of your database connections, especially if you’re working with critical data sources. Superset provides logging and error reporting to help diagnose issues quickly.
FAQ – Creating Your First Dashboard
1. What is a dashboard in Apache Superset?
A dashboard in Apache Superset is a visual display that combines multiple data visualizations, such as charts, graphs, and tables, on a single screen. It provides an interactive way to monitor key metrics, explore data trends, and gain insights, all in one place.
2. How do I start creating a dashboard?
To start creating a dashboard, you’ll first need to explore a dataset in Apache Superset. Begin by navigating to Data > Datasets, where you can select the dataset you want to visualize. After selecting the dataset, click on Explore to enter the visualization interface. Here, you can choose the chart type, configure the settings, and generate the visualization. Once you’re satisfied with the result, save the chart and add it to a new or existing dashboard.
3. Can I create a dashboard from scratch?
Yes, you can create a dashboard from scratch. Start by navigating to the Dashboards section from the main menu and selecting + Dashboard to create a new one. In the dashboard editor, you can add saved charts by clicking + Chart and selecting the visualizations you want to include. You can then arrange the charts on the grid, resize them, and customize the layout to create a dashboard that meets your needs.
4. How do I add filters to my dashboard?
Adding filters to your dashboard allows users to interact with the data more dynamically. To add a filter, go to the dashboard editor and select + Filter. You can configure the filter to apply to one or more charts on the dashboard. Depending on the filter type, users can adjust data by selecting date ranges, categories, or other variables, which will automatically update the visualizations in real time.
5. Can I share my dashboard with others?
Yes, sharing your dashboard is straightforward. After creating and customizing your dashboard, save it to publish the content. You can then share the dashboard’s URL with others who have access to your Superset instance. Make sure the appropriate permissions are set so that the people you share it with can view and interact with the dashboard as intended.
6. How do I customize the appearance of my dashboard?
Customizing the appearance of your dashboard in Apache Superset is straightforward. You can adjust the layout by dragging and dropping charts into different positions, resizing them, and arranging them to fit your design preferences. Additionally, you can add headers, text boxes, and dividers to enhance the visual organization of the dashboard. Superset also allows you to customize the color schemes and styles of individual charts, helping to align the dashboard’s look and feel with your specific needs.
7. What should I do if my dashboard isn’t loading properly?
If your dashboard isn’t loading properly, there are a few troubleshooting steps you can take. First, check your internet connection and ensure that the Superset server is running smoothly. If the issue persists, try refreshing the page or clearing your browser’s cache. It’s also helpful to review the individual charts within the dashboard to see if a specific query or data source is causing the problem. In some cases, optimizing the queries or adjusting the data source settings might resolve the issue.
8. How can I update or modify an existing dashboard?
To update or modify an existing dashboard, start by navigating to the dashboard you want to edit. Once there, enter edit mode by clicking the Edit Dashboard button. This will allow you to rearrange charts, add new visualizations, or make changes to existing ones. You can also update the filters, change the layout, or add additional elements such as text boxes or images. After making your changes, be sure to save the dashboard to apply the updates.
9. Can I duplicate an existing dashboard?
Yes, duplicating a dashboard in Superset is possible. To do this, go to the dashboard you wish to duplicate, click on the Actions dropdown menu, and select Duplicate Dashboard. This creates a copy of the dashboard, which you can then modify or customize without affecting the original. Duplicating dashboards is useful for creating variations or experimenting with different layouts and configurations.
10. How do I delete a dashboard?
Deleting a dashboard is a simple process. Navigate to the dashboard you want to remove, click on the Actions dropdown menu, and choose Delete Dashboard. Confirm the deletion when prompted. Be aware that deleting a dashboard is permanent, so ensure that it’s no longer needed before proceeding. If you only need to remove a dashboard temporarily, consider disabling it or restricting access instead.
By now, you should have a solid understanding of how to set up, connect, and create your first dashboard in Apache Superset. This powerful tool can transform the way you interact with your data, enabling you to derive meaningful insights and make data-driven decisions with confidence.
If you’re ready to take your data skills to the next level, Data Engineer Academy is here to help. We offer hands-on training that goes beyond the basics, providing you with real-world experience and the expertise needed to excel in the field of data engineering. Whether you’re just starting out or looking to advance your career, our personalized training is designed to equip you with the tools and knowledge you need to succeed.

