

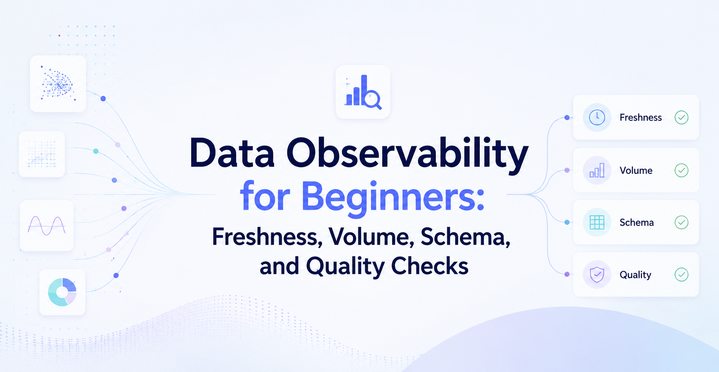
Data Observability for Beginners: Freshness, Volume, Schema, and Quality Checks
Data observability is the practice of checking data systems so teams catch bad data before people trust it. It tells you when data is late, missing, changed, or wrong. For beginners, the foundation is four checks: freshness, volume, schema, and quality.
Those checks help stop quiet failures from reaching dashboards, reports, and downstream models. Once you can spot stale tables, row drops, broken columns, and bad values early, data pipeline monitoring starts to feel practical.
Key Points
- Freshness checks show whether data arrived on time.
- Volume checks catch sudden drops, spikes, and duplicates.
- Schema checks flag broken columns and type changes.
- Quality checks test whether values are valid and complete.
- Start with one important dataset and clear ownership.
Quick summary: Most beginner data failures come from late data, missing rows, changed columns, or wrong values. These four checks catch the issues teams feel first.
Key takeaway: Start with one high-impact table and a few checks people will respond to. Clear ownership matters more than broad coverage.
Quick promise: If you add freshness, volume, schema, and quality checks in that order, you’ll reduce surprise in downstream dashboards fast.
Why data observability matters before bad data spreads
Bad data rarely announces itself. A daily load can finish late, a source can send half the usual rows, or a renamed column can slip into production. Dashboards may still load, which makes the problem easy to miss.
That is why data observability matters. It adds context to data pipeline monitoring, so teams can catch issues before finance, product, or operations make the wrong call.
The difference between data monitoring and data observability
Monitoring looks for known failures, such as a job that crashed or a task that never started. Observability helps you find the unknowns, even when the pipeline looks healthy. For example, an Airflow run can succeed while the orders table still arrives two hours late.
What usually breaks in a data pipeline
Late source feeds, row count drops, schema changes, null spikes, and duplicate records show up often. Each one can damage something downstream, including dbt models, BI dashboards, feature stores, or customer reports.
How freshness checks tell you when data is late
Freshness checks ask a simple question: is this data up to date? Stale data looks normal at first. An hourly dashboard may show no new incidents, not because nothing happened, but because the latest hour never landed.
Different datasets need different freshness rules. Near real-time event tables may allow only a few minutes of delay. Daily finance tables may only need to arrive before the first morning review.
Simple ways to define freshness for each dataset
Most teams use an expected arrival time, a maximum age, or a last-updated timestamp. The threshold should match the business need, because a support queue and a monthly planning table don’t need the same clock.
What to do when freshness checks fail
Start upstream. Check the source system, the scheduler, and the last successful run, then route the alert to the owner who can fix it. A freshness alert without clear ownership usually gets ignored.
Why volume checks catch missing or bloated data fast
Volume checks watch how much data arrived. They compare row counts, file sizes, or event totals with a normal pattern. A sharp drop can mean missing data, while a spike can point to duplicates, replays, or bad join logic.
These checks work well because quantity shifts stand out fast. If a table usually holds 1 million rows and today has 100,000, something changed even if the load itself says “success.”
Using baseline ranges instead of fixed numbers
Historical ranges beat hard thresholds in most cases. Weekends, month-end jobs, and product launches change normal volume, so good rules account for day-of-week patterns and seasonality.
Volume alerts that are useful, not noisy
Tune alerts so they fire on real shifts, not every wobble. Group repeats and send them to the right owner, otherwise alert fatigue kills trust.
How schema checks protect downstream tables and dashboards
Schema checks verify column names, data types, null rules, and required fields. They protect the contract between source tables, transforms, dashboards, and APIs. One upstream change can break several downstream jobs.
Schema drift happens all the time. A vendor renames a field, a product team adds nested JSON, or a number becomes a string. The pipeline may keep running, but casts, joins, and reports can fail later.
Common schema changes that cause trouble
Renamed columns break SQL references. Type changes can fail casts or sort incorrectly. Removed fields leave blanks in reports, and new nested structures can confuse parsers.
When to block a bad schema and when to warn
Use hard failures for critical tables, especially finance or executive reporting. Use softer warnings in raw or exploratory layers, where flexible ingestion matters more than strict shape.
Quality checks that go beyond row counts and column names
Freshness, volume, and schema checks tell you when data is late, the wrong size, or shaped the wrong way. Quality checks answer a harder question: do the values still make sense? This is where data reliability checks move from structure to truth.
A table can be fresh, full-sized, and perfectly typed and still be wrong. A country field may suddenly contain invalid codes. A customer ID may repeat when it should be unique. Reports won’t always crash. Sometimes they simply lie.
The most useful quality tests for beginners
Start with null-rate checks on required columns, duplicate detection on business keys, and uniqueness tests where one record should appear once. Then add allowed values, range checks for dates or amounts, and referential integrity so child rows still match a parent table. Tools like dbt, Great Expectations, Soda, and plain SQL can all handle these tests.
How to decide which checks matter most
Begin with tables that drive executive dashboards, finance reports, SLAs, or customer-facing metrics. If bad data can change a decision, add tests there first. Low-risk tables can wait.
A simple starter plan for data observability
Getting started doesn’t require a huge rollout. Pick a critical dataset, add a few clear rules, assign an owner, and send alerts where that owner already works.
Pick one pipeline and watch it closely first
Start with the pipeline that breaks often or matters most, such as daily orders, billing, or sign-up events. One well-observed pipeline teaches more than twenty half-finished ones. It also creates a visible win, which helps the team adopt the process.
Build an alert path that someone will actually use
Alerts need context. Include the dataset name, the failed check, recent values, and the last successful run. Then send it to Slack, email, PagerDuty, or a ticketing tool based on urgency. Whether you use warehouse SQL, dbt tests, Soda, Great Expectations, Monte Carlo, or similar tools, the rule stays the same: the alert should help someone act fast.
FAQ
What is data observability?
It means watching your data so you know when it becomes late, incomplete, changed, or wrong. Instead of waiting for a stakeholder to spot a bad dashboard, your team gets an early signal and can fix the problem before it spreads.
What’s the difference between freshness and quality checks?
Freshness checks ask whether data arrived on time. Quality checks ask whether the values are trustworthy. A table can be fresh but still fail quality if it contains duplicates, null spikes, bad codes, or impossible numbers.
Do small teams need a dedicated data observability tool?
No, not at first. Small teams can start with SQL checks, dbt tests, scheduler alerts, and a simple Slack notification flow. A dedicated tool helps later, especially when the number of datasets, owners, and alerts grows.
Which dataset should beginners monitor first?
Start with the dataset people trust most or the one that breaks most often. Good first choices include daily orders, billing, sign-ups, or any table behind an executive dashboard. If bad data there changes a decision, monitor it first.
What should I learn next after data observability?
Practice on a real pipeline next. Data Engineer Academy’s DE Projects Course is a strong step if you want guided work on monitoring, testing, and troubleshooting. After that, read a deeper article on data pipeline monitoring or dbt tests to build from these basics.
Conclusion
Data observability gives teams an early warning system for broken data. Freshness catches late loads, volume spots missing or bloated records, schema protects structure, and quality checks tell you whether the values still make sense.
The best beginner move is small and concrete. Start with one critical dataset, add a few checks, and refine them over time. Reliable data grows from habits, not from a giant rollout.